Most salary surveys give you a national median and call it a market. This one doesn’t. We looked at 334 individual data points from field commercial roles in the -omics capex, reagents, and distributor segment — and found that neither state wins outright. The answer shifts with career stage, and each shift has a different driver.
This edition looks at one specific slice of the US life sciences economy — field commercial roles in the -omics capex, reagents, and distributor segment — and at the two states where most of that activity sits: California and Massachusetts. We set out to answer two questions: Do California and Massachusetts pay the same for the same role at the same career stage? And if not, what explains the gap, and is it stable enough to plan a career around?
Short answer: no, and partly. Some of the gaps are structural and durable. Others are timing artefacts of regulation that has not yet propagated across both states.
What moved -omics commercial pay in 2025
Before the state-by-state comparison, three forces reshaped the market this year and you can’t read the numbers without them.
Variable compensation collapsed; base held
Base salaries were flat to up across the segment, but commission attainment, discretionary bonuses, and equity value all dropped sharply. Total earnings in 2025 ran well below 2022–23 levels — a downstream effect of biotech funding cuts, multiple rounds of layoffs at growth-stage and large-cap companies, and a near-total freeze in the IPO window since 2022.
Federal funding cuts hit unevenly
NIH grant terminations and the proposed 15% indirect-cost cap reset academic purchasing assumptions. Tufts alone reported 38 federal grant terminations in 2025. Reagent and capex reps selling into academic accounts felt it first, particularly at smaller, growth-stage companies. Pharma-facing capex held up because pharma R&D budgets don’t track NIH allocations.
The H-1B supplemental fee changed early-stage hiring math
The 2025 proclamation imposing a $100,000 surcharge on certain new H-1B petitions effectively prices small biotechs out of international commercial sponsorship. Senior commercial roles are mostly domestic anyway, so the practical effect on this segment is limited to early-career technical hires and the occasional FAS recruited from outside the US.
The State-by-State Picture
California or Massachusetts — who pays more?
Neither state wins outright. The answer shifts with career stage, and each shift has a different driver — which is why a single state-level average tells us nothing useful.
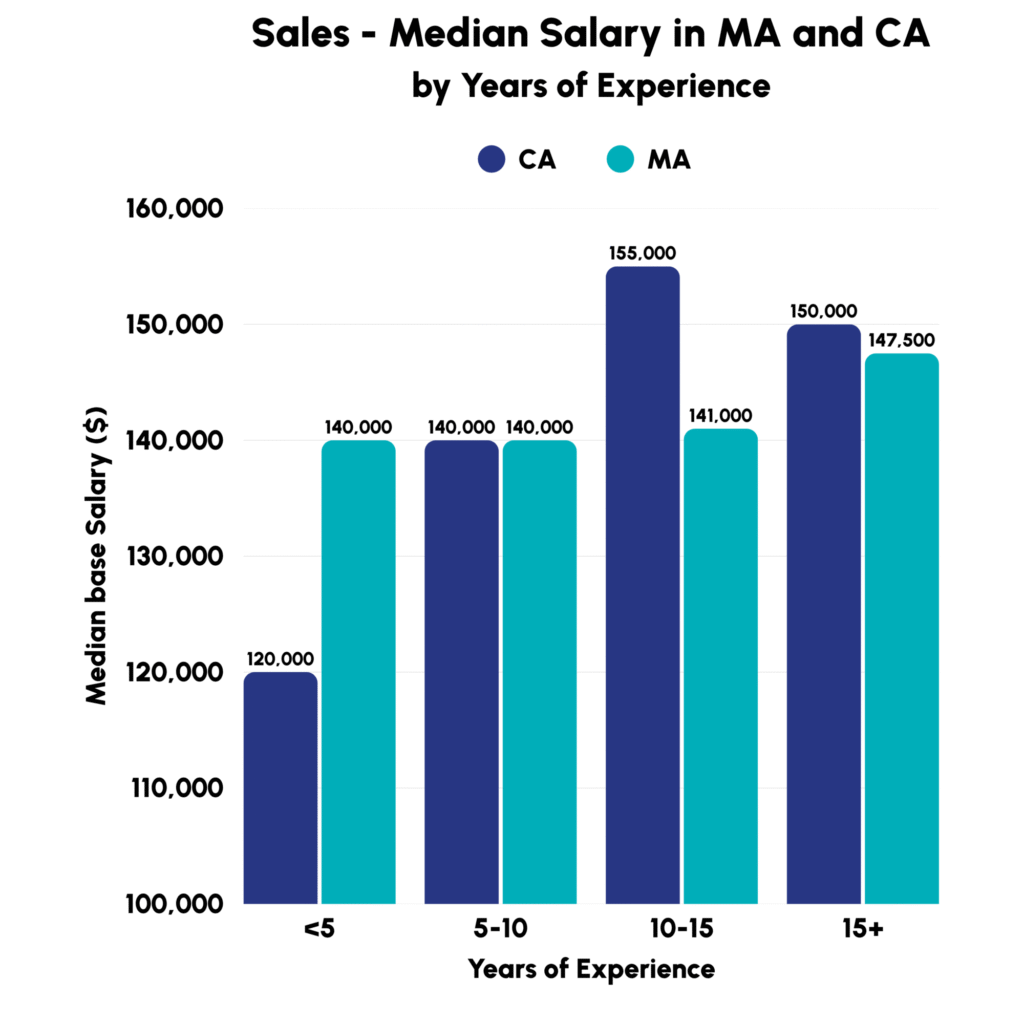
Under five years in, Massachusetts pays more by about $20K at the median. Greater Boston is the densest biopharma cluster in the world: Kendall Square alone holds more than 100 companies within a single zip code. That density sounds like it should pull pay down through supply — but for -omics companies it does the opposite, because the realistic exit options for a Boston-area life sciences graduate narrow quickly to life sciences. In California, the same graduate can choose between pharma, therapeutics, AI applied to biology, or general tech. Massachusetts companies end up competing directly with Vertex, Moderna, and Pfizer’s Cambridge operations for Harvard, MIT, BU, and Tufts graduates who typically arrive with multiple offers.
Between five and ten years, the two states converge at $140K median base. By this point, candidates compete on deal history rather than school pedigree, and the employer mix is similar on both coasts. Equity lock reinforces the convergence: by year five, the initial RSU grant has vested, but most candidates at large employers are sitting on a stack of partially vested annual refresh grants. Leaving means giving up that unvested stack, which slows movement and keeps salary pressure off employers.
From ten to fifteen years, California pulls ahead by about $14K — the largest gap in the dataset. The senior commercial talent pool is bicoastal, with Illumina, 10x Genomics, Bio-Rad, and Agilent on the California side; Thermo Fisher, Bruker, Waters, and Revvity on the Massachusetts side. But there’s a specific dynamic at this level: -omics reps whose main channel is pharma R&D command higher salaries than their academic- or biotech-facing peers, because selling into large pharma accounts at this seniority is a different job with different deal sizes and buyer sophistication. Through internal equity, those higher numbers pull up the whole California cohort.
Past fifteen years, the gap nearly closes — just $2.5K separates the two. Senior commercial roles travel anyway, large employers cap base through standardised pay bands, and competition shifts to long-term incentives, retention RSUs, and benefits. Geography flattens — but as we’ll see, that doesn’t mean every gap closes at this level.
“The same market is simultaneously bidding employed talent up and laid-off talent down. Treating the two pools as one market is the most common pricing error we saw in 2025.”
“Base is just a floor” — not anymore
The framing most candidates use to think about US life sciences compensation — “base is just the floor, total comp is the real number” — was correct for most of the last decade, reached its peak during Covid, and is now substantially wrong for this segment.
Commission plans that paid from the first dollar, accelerators that kicked in at quota, equity that delivered life-changing returns for commercial people who timed it right — that story is still alive in diagnostics and clinical. For -omics specifically, equity has lost 70–90% of its value from its peak. In 2025, -omics commercial professionals who on paper looked reasonably compensated were taking home meaningfully less in total cash than peers in equivalent roles two or three years earlier.
One paradox SRC saw in 2025: candidates who have a job are negotiating harder on base than at any point in the last few years. With variable evaporated and equity discounted, they refuse to anchor on old base numbers — they want the cash they are giving up on the variable side rebuilt into base, knowing it is the only component they can rely on. Candidates who have been laid off, by contrast, are getting lowballed: longer time on market, more competition per role, and offers that come in below their last base.
Two states, two different mechanisms
The gender pay analysis splits cleanly by state — and the two states go in opposite directions.
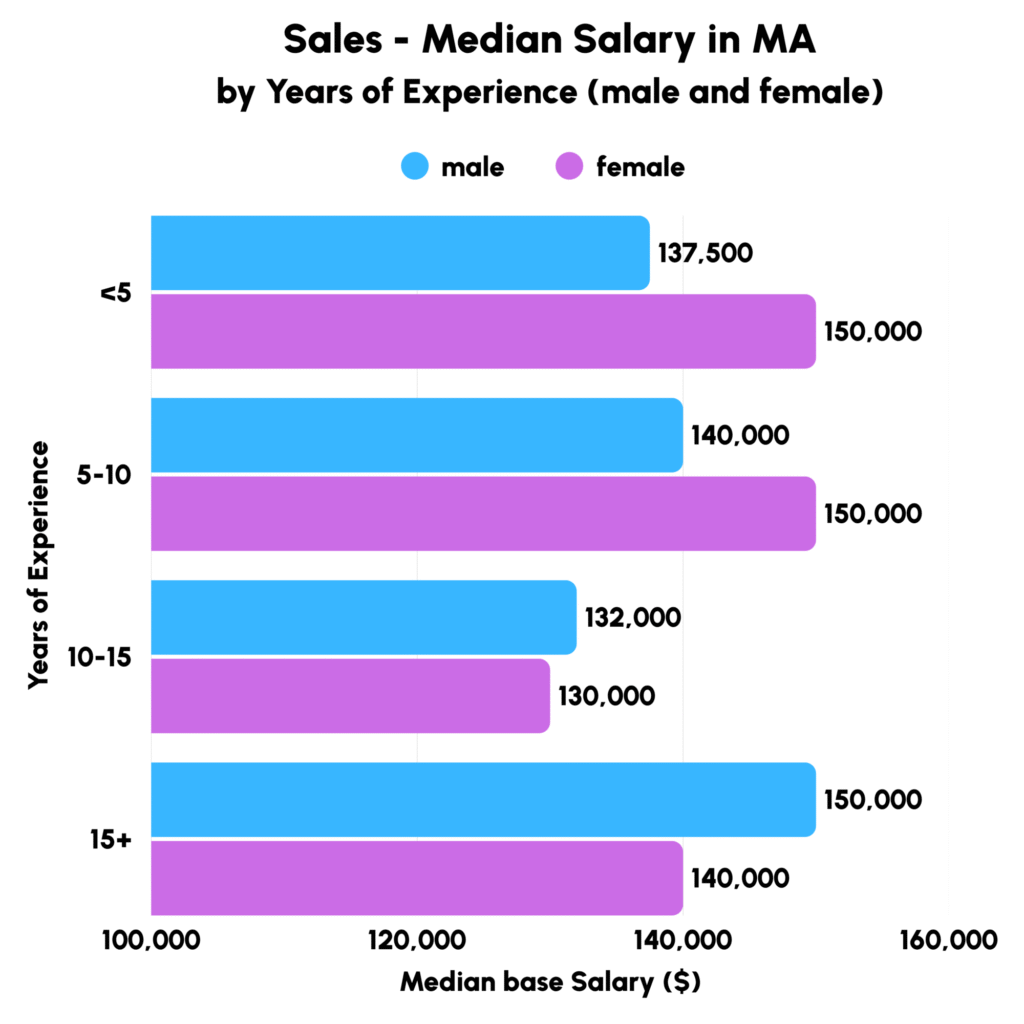
Massachusetts: women lead early, men lead late
Under five years, women’s median base in MA sales runs at $150K versus $137.5K for men — a $12.5K advantage. The advantage holds at 5–10 years ($150K vs $140K). At 10–15 years, the two are effectively tied, and at 15+ men pull clearly ahead ($150K vs $140K). The early and mid-career advantage is one of the most interesting patterns in the dataset. The reversal at senior levels is easier to read: past fifteen years, pay is individually negotiated rather than set by a scale, and career breaks during the 10–15 year window tend to leave a dent in base that doesn’t fully recover. Many of the most senior women in MA biotech sales were also hired at a time when pay gaps weren’t closely scrutinised, and those original numbers have a long tail.
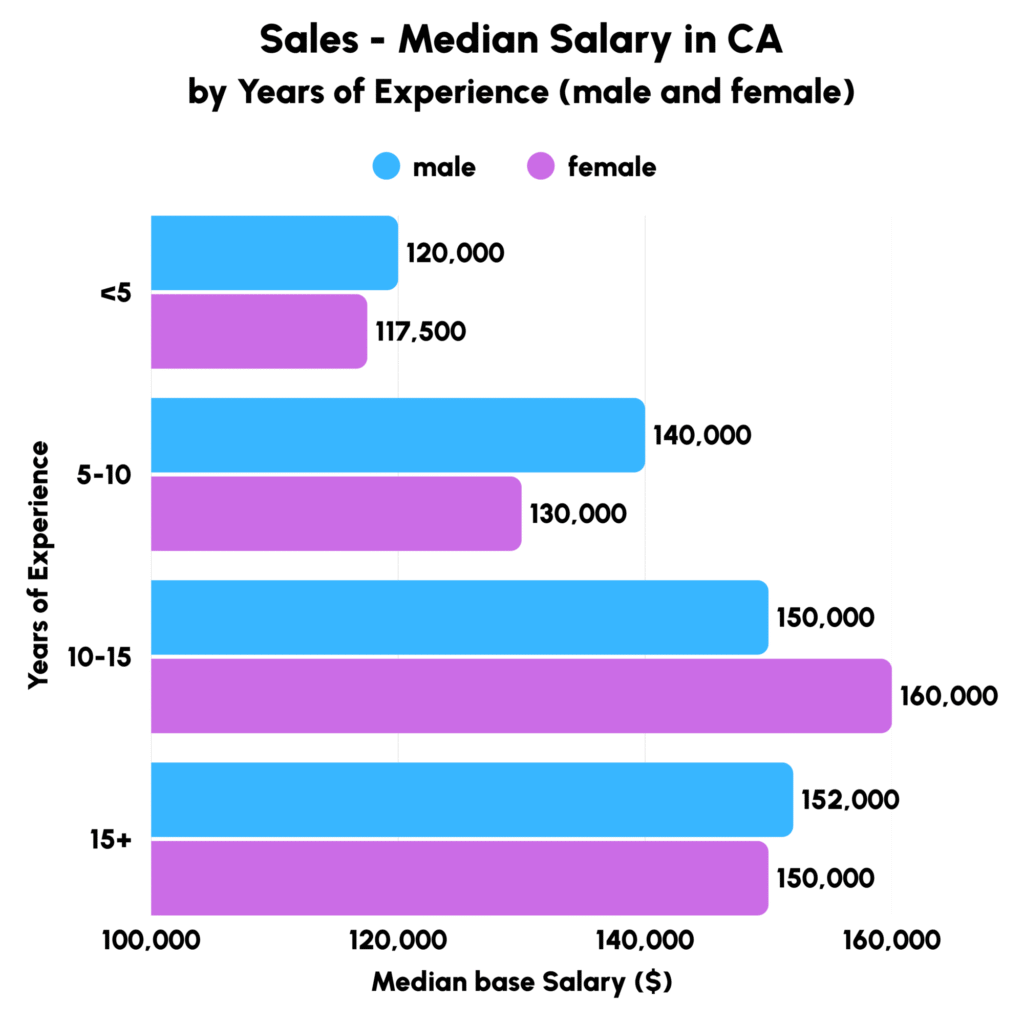
California: women trail early, lead in mid-career, converge at the top
Under five years, women in CA sales sit at $117.5K versus $120K for men — a small disadvantage. At 5–10 years, the gap widens ($130K vs $140K). Then, in the 10–15 year bracket, women’s median base jumps to $160K — $10K above men at the same stage — before the two roughly converge at 15+ ($150K vs $152K). The mid-career bump is the most striking feature in either state’s dataset, and it lines up closely with the timing of California’s pay transparency regime.
California’s SB 1162 took effect on January 1, 2023, requiring employers with 15 or more employees to publish salary ranges in job postings. Massachusetts only introduced equivalent requirements on October 29, 2025 — two years behind California. Two years is enough to matter, particularly for the cohort hired into senior commercial roles between 2023 and early 2025, whose base salaries anchor everything that follows them.
The maternity leave comparison also runs opposite to what most readers assume. Massachusetts PFML provides up to 12 weeks of family bonding leave with a tiered wage-replacement formula, capped at $1,230.39 per week in 2026. California Paid Family Leave provides 8 weeks at 70–90% of wages (90% for workers earning under ~$63,000), following the SB 951 update that took effect in January 2025. Massachusetts is the more generous regime on duration; California is more generous on wage replacement across most of the income distribution.
But the variable that matters for long-term salary anchoring is what candidates come back into, more than the leave itself. A California woman returning from PFL in 2024 came back into a market with mandatory posted ranges and a years-old prohibition on salary-history questions. The leave generosity helped her stay employed and paid through the break. The transparency regime helped her not lose ground when she came back.
Where the mid-size premium comes from
Compensation follows a clean arc across company size in both states: lowest at the smallest firms, highest at mid-size, and plateauing at large ones. The mechanics differ by stage in ways that matter for candidates.
Small (1–10 employees)
Pre-revenue or early-revenue -omics companies constrain cash compensation structurally. Founders offset lower base with equity, and the role scope is extreme — a commercial hire at a five-person -omics startup is doing business development, key-account capture, application support, and channel strategy simultaneously. The implied total comp can be competitive on paper if you assume a successful exit.
Mid-size (11–200 employees) — the premium tier
This is where the pay premium sits, driven by three specific dynamics. First, the post-Series-B hiring sprint: when a company closes a Series B or C with a board-committed headcount plan tied to instrument-placement targets, the commercial hires have to land within months — cash is the only lever that moves talent on that timeline. Second, the reference-customer race: in any new -omics platform category, the first ten reference accounts disproportionately shape the next hundred, and reps capable of landing a Broad, a Sanger, or a top-tier pharma R&D site command a premium. Third, the instrument-placement velocity problem: capex sales cycles in this segment run 9–18 months, a mid-size company with 12–18 months of runway needs reps who can compress that cycle, and senior reps who have done it before name their price.
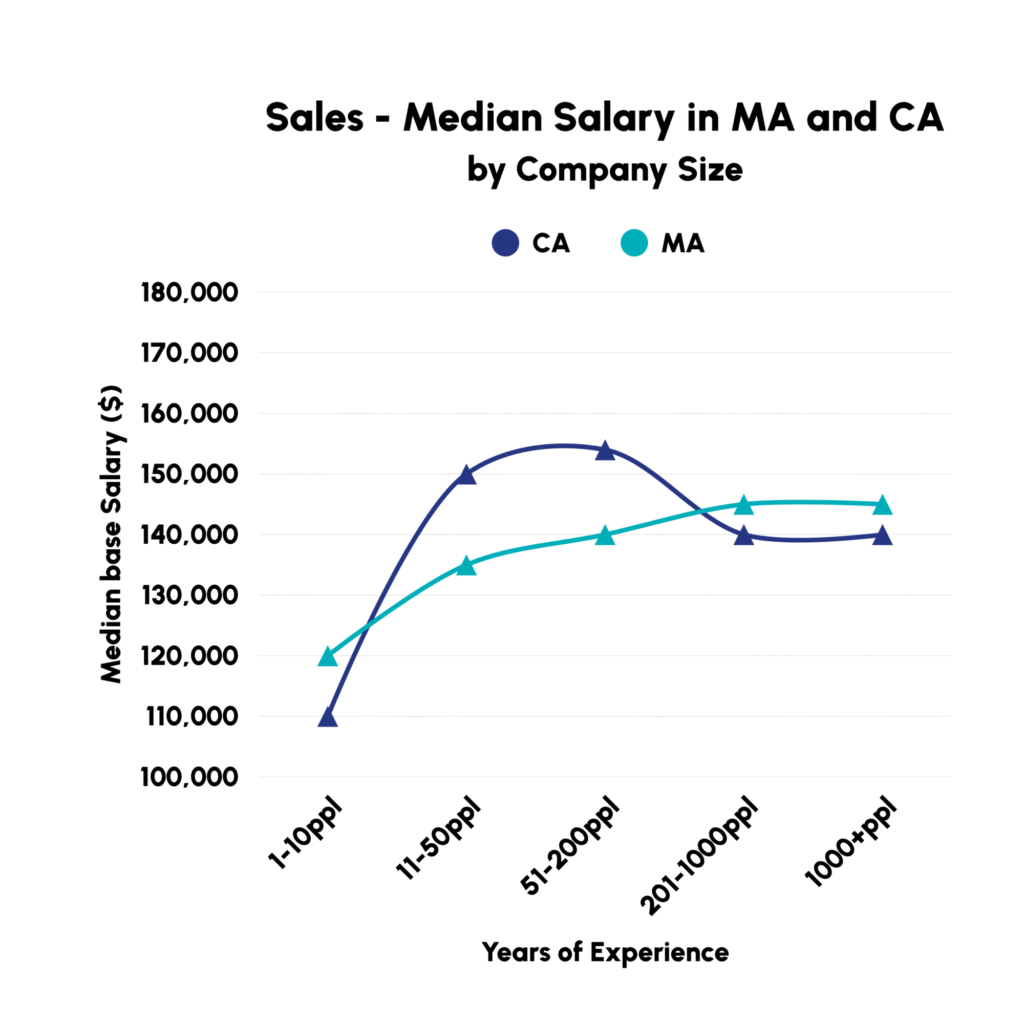
Large (200+ employees)
HR sets standardised bands with hard caps that line managers cannot override on individual merit. Internal equity becomes binding — paying a new external hire significantly above existing team members at the same level creates retention risk across the whole team. Competition shifts to total package: bonus targets, RSU refresh grants, ESPP, 401(k) match, and benefits. For a senior person choosing between $140K base at a large company and $160K plus equity at a growth-stage company, the structural details of the equity are the entire decision.
What this means for candidates and hiring managers
For candidates
The right question isn’t California or Massachusetts — it’s career stage, whether your accounts are pharma-facing or academic-facing, and company stage. Early career, MA pays more in base, and its higher-base/lower-variable structure is an advantage worth protecting when variable compensation has been hollowed out. Mid-career, the leverage shifts to whoever is hiring against a board-committed Series B or C plan — cash is the only lever that moves on that timeline. Senior, geography flattens and equity terms become the whole decision: grant size, strike, vesting, and acceleration matter more than headline base, particularly with the IPO window mostly closed since 2022.
Two patterns cut across all stages: pharma-facing roles pay more than academic-facing roles at the same seniority; and employed candidates have more pricing power on base than at any point in the last five years. Laid-off candidates have less than they think.
For hiring managers
Candidates who were given unrealistic targets in a market where research labs don’t have money to invest in new instruments won’t anchor on OTE numbers — offers built on old variable assumptions are coming back as counters that ask for the gap rebuilt into base. Mid-size companies post-Series B are competing for senior people against pharma sales and large-cap retention packages; discounting cash to protect internal equity will cost the hire.
Massachusetts employers with heavy academic-account exposure should assume the 2025 federal funding picture flows directly into 2026–27 candidate expectations. One pricing error worth naming: treating employed and laid-off candidates as one market. Using offers from the second pool to set bands, then trying to hire from the first pool against those bands, is the most common mistake we saw in 2025.
About the dataset
334 data points collected in 2025 from industry professionals in field sales roles across capex, reagents-focused biotech companies, and distributors in the broader -omics space. Figures reflect base salary only — bonuses, commissions, pensions, and car allowances are excluded. Years of experience are calculated from the first relevant full-time, customer-facing role in the field; academic training and internships are excluded.
This analysis was prepared by Dr. Yuliia S., with editorial leadership by Bert Trentelman. Thanks to the whole SRC Search team for data contribution.