This benchmark analyses base salary ranges for commercial sales and field support roles across European biotech and -omics companies, based on 956 data points collected from professionals in the UK, Germany, Switzerland, France, Benelux, and Nordic markets in 2025.
Key Findings
- Switzerland is Europe’s highest-paying biotech market, with base salaries €30k-40k above neighbouring Germany and Austria.
- Italy and Spain are among the lowest-paying European markets for -omics commercial roles.
- The UK shows the widest salary variation, with Golden Triangle (London, Cambridge, Oxford) paying 10-20% more than the rest of the country.
- Île-de-France base salaries average ~30% above the rest of France.
- US and Chinese companies entering Europe pay 20-30% above local market levels to attract talent quickly.
- The 6-10 year experience band is the fastest-growing earning phase across all markets.
- A gender pay gap of at least 5% remains visible at similar experience levels in several countries.
- The EU Pay Transparency Directive becomes enforceable June 7, 2026, requiring salary ranges in job ads.
Introduction
How do most companies benchmark commercial salaries? They buy a compensation survey. Often, from a consulting firm. They look at a clean spreadsheet and trust the median.
The problem is that most benchmark datasets group together very different realities – big pharma and 20-person US capex startups, reagent distributors and complex capital equipment manufacturers, stable German Mittelstand businesses and PE-backed growth companies.
It looks nice. It feels objective. It keeps budgets “safe.” It also ignores context.
Candidates receive offers 20-30% below their current base and feel insulted. Processes restart. Roles stay open for 6+ months. Companies move through vicious cycles of interviews and rejections, hoping the “right” candidate will accept the budget – or they hire someone within budget and face trade-offs later in longer onboarding, slower ramp-up, and missed revenue.
Eventually, someone gets blamed. Often the internal recruiter (already stretched thin), who is expected to find a needle in a haystack. Or the external partner (sometimes portrayed as a “greedy shark”) who brings candidates aligned with market reality, only to be told they are “too expensive.”
Each year, Team SRC speaks with thousands of customer-facing professionals across Europe in both sales and support roles. Although the main biotech hubs operate within the same European framework, their salaries differ significantly, particularly in the Omics Sales and Support Salary.
This difference is often underestimated – not only by foreign companies entering the EU, but also by European companies expanding into neighbouring countries. Geographic proximity does not mean structural similarity. Each region follows its own patterns, shaped by cultural nuances, labour rules, and local expectations. As a result, salary benchmarks do not transfer cleanly from one country to another – and even less so from one continent to another.
This edition provides first-hand data indicating current salary levels and tendencies, and defines what market alignment looks like for commercial professionals in sales and support within the -omics space. It includes insights into the Omics Sales and Support Salary.
Compensation friction rarely comes down to what a company can pay. It comes down to which market they’re comparing themselves to.
Understanding the Omics Sales and Support Salary landscape is crucial for professionals navigating this industry.
Key salary trends in Europe: Omics Sales and Support Salary Insights
Location drives pay more than anything else. Major biotech hubs and capital regions pay more – often up to 30% above national averages. This is less about cost of living and more about being close to key accounts and revenue centres. Switzerland is the highest-paying market. Italy and Spain are among the lowest. The UK shows the biggest salary variation nationwide.
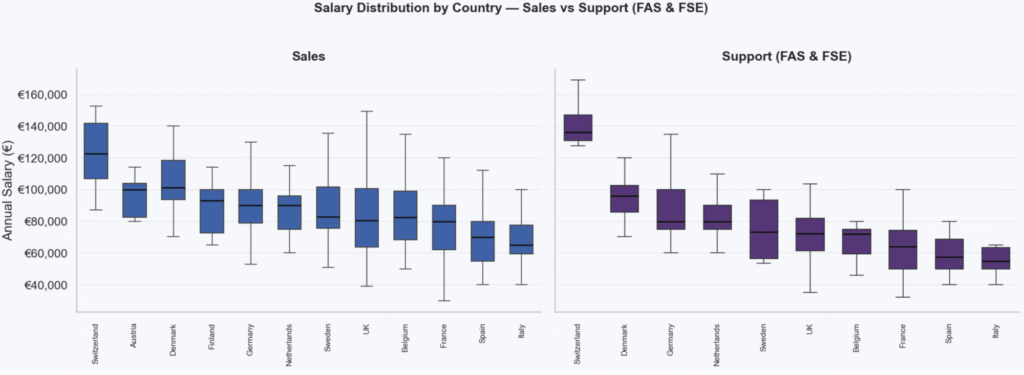
The closer you are to revenue, the more you earn. Sales roles usually have the highest earning potential (base). Technical field roles (FSE/FAS) vary depending on territory size, installed base, and market importance. Support roles pay less but are more stable and show less regional variation.
Company origin affects compensation. US and Chinese companies entering Europe often pay 20–30% above local market levels to grow fast. They may offer higher base and stronger commission – but sometimes fewer traditional benefits. These roles often come with more pressure and less long-term stability.
Labour laws shape salary growth patterns. In strongly protected markets (e.g., Germany, France, Nordics), salary growth is more structured and predictable. In less protected markets (e.g., UK, Italy, Spain), salaries – especially in sales – vary more and progression can be less favourable for senior professionals.
Portfolio matters. Capex roles offer the highest base salaries across all functions. These roles involve longer, more complex sales cycles and higher commercial risk. Pay is generally lower in specialized kits and reagents, lower again in generic portfolios, and typically lowest in distributor models.
A gender pay gap remains visible. In several countries, men and women at similar experience levels show at least a 5% base salary difference. This is linked to structural and legal factors and requires deeper analysis.
The 6-10 year experience window is the key earning phase. Professionals in this range see the fastest salary growth. They are experienced, independent, and productive – but not yet priced like leadership. For employers, this is the most competitive talent bracket. For professionals, it is the most critical career window. After 15 years, salary growth often slows or plateaus unless moving into leadership or high-impact commercial roles.
We will now take a closer look at base salary trends across the four key markets: UK, DACH, France, and Benelux.
United Kingdom
- The UK remains one of Europe’s leading biotech hubs – and location still drives pay. The Golden Triangle (London, Cambridge, Oxford) pays 10-20% more than the rest of the UK. England also outpaces Scotland, Wales, and Northern Ireland by about 15%. Where you sit directly impacts what you earn.
- Support roles often start on higher base salaries than early sales. The UK’s deep scientific heritage means customers expect strong technical capability from the outset – you’re stepping straight into complex, high-level conversations. That drives competition for technically sharp, customer-ready professionals. The long-term earning ceiling, however, is typically lower than in sales.
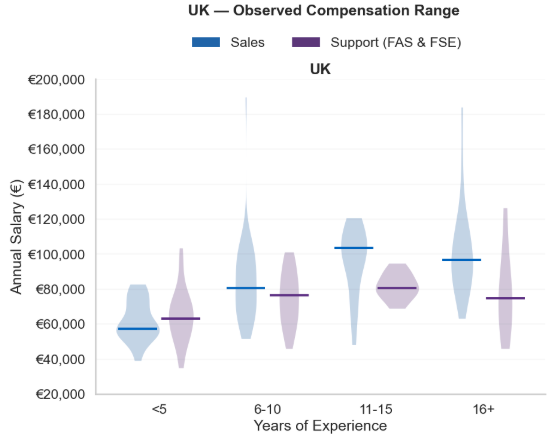
- The 11–15 year experience band is the sweet spot. Experienced, sharp, fully productive – but not overpriced. This is where support salaries are most stable and sales pay stays strong. It’s the point where the market pays with confidence.
- Beyond 15 years, salaries often flatten – and sometimes dip. It’s largely structural: fewer senior roles, tighter progression, and a clear preference for mid-career hires. The UK market is often described as age-sensitive, and many senior professionals face more friction when moving roles. At the same time, this group shows real “make-or-break” behaviour: while median salaries tend to be lower than the 11–15 year band, pay variation is much wider. In sales, earnings can range from ~£55k to £170k; in support roles, from ~£40k to £110k.
DACH
- The DACH region is Europe’s second-largest biotech market after the UK. It is anchored by Germany’s scale and structured commercial landscape, complemented by Switzerland’s globally dominant pharma network, and supported by a smaller Austrian market that is often managed operationally from Germany or Switzerland.
- Within Germany, Bavaria hosts the largest concentration of commercial professionals, followed by Baden-Württemberg and North Rhine-Westphalia. Salaries in these three states are proportionally higher than in the rest of Germany – on average 10–20% above other regions. The lowest compensation levels are generally found in Eastern Germany, with the notable exception of Berlin, where salary levels are comparable to the top three regions.
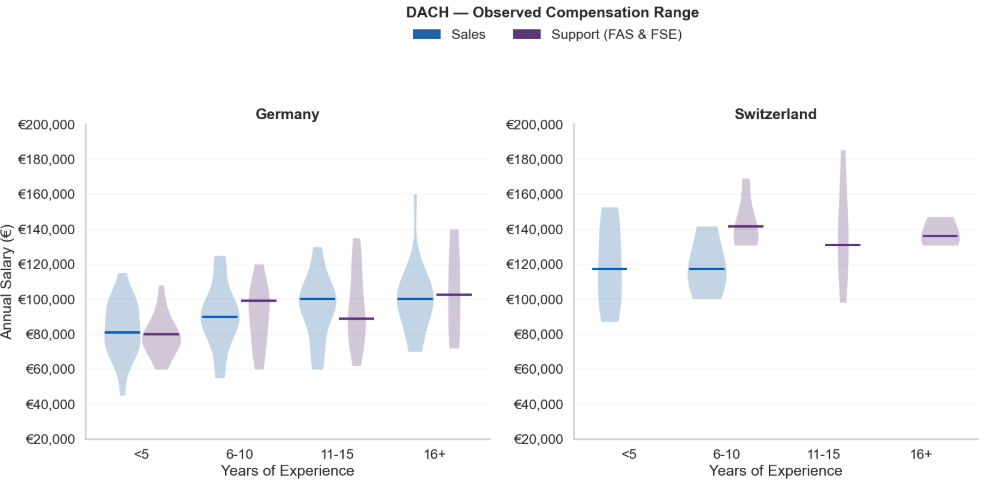
- Germany is characterised by stable, seniority-driven salary progression. Long notice periods and strong labour protections contribute to workforce stability and predictable compensation growth. It is also the only market in our dataset where certain early commercial or technical support roles can already reach very high base salaries – in some cases approaching €110k within the first five years – with continued steady progression thereafter.
- Switzerland – especially Basel and Zurich – plays in a different league. It is a global pharma powerhouse with a cost structure to match. Once companies reach a certain level of maturity, or need dedicated pharma-facing expertise, they move commercial roles directly into Switzerland. Smaller companies often cover Switzerland from Germany to keep costs under control. This difference is clearly reflected in salaries: Swiss base pay is typically €30k–€40k higher than comparable roles in neighbouring Germany or Austria at similar experience levels.
France
- France is the third-largest biotech market in Europe, with commercial activity heavily concentrated in Île-de-France, followed by Auvergne-Rhône-Alpes and the Lyon metropolitan area. Outside these hubs, roles quickly become more territory-driven and travel-intensive. Paris clearly stands apart: base salaries in the Île-de-France region are on average around 30% higher than in the rest of the country – despite generally requiring less travel. The reason is simple: this is where the population, headquarters, and key institutional accounts are most concentrated.
- Across France, salaries are relatively structured and predictable in both sales and support roles. Early-career pay usually starts lower than in markets like Germany, but growth becomes more visible after about five years. Once professionals build strong customer relationships and take ownership of accounts, compensation increases more clearly. In our view, France is a very relationship-driven market: who you know and the trust you build often matter as much as what you know. Strong labour protections also support stability, so career progression tends to depend more on long-term relationships than on frequent job changes.
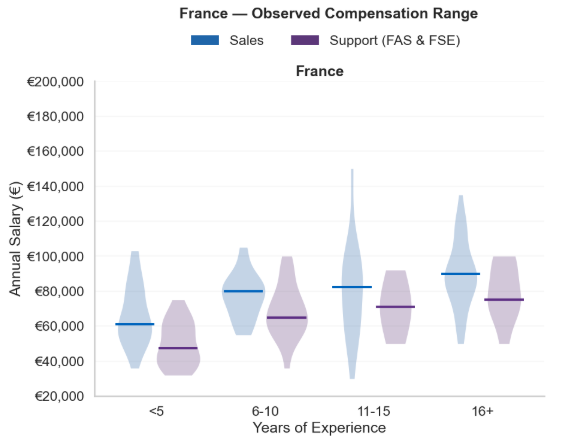
- The real inflection point comes around the 10-year mark – especially in sales. Between 10 and 15 years of experience, salary variation widens significantly. This is where careers either accelerate or stabilise. Professionals who change roles, expand territories, or take on larger responsibility during this window tend to pull ahead. Those who remain in static roles often see slower growth.
- Support roles show a similar early jump after five years, but the ceiling appears earlier. While technical expertise is valued, base salaries in support functions tend to level off at senior stages unless professionals move into commercial or leadership roles.
Benelux
- The Benelux region brings together Belgium, the Netherlands, and Luxembourg. The Netherlands has the larger commercial workforce, concentrated around the Randstad. In Belgium, commercial activity is strongest in Flanders and Brussels, while Wallonia represents a smaller share of the market. Luxembourg plays only a minor role in biotech and is typically managed from Belgium or the Netherlands rather than supported by standalone commercial teams.
- Looking at Belgium alone, Brussels generally shows the highest pay, followed by Flanders, with Wallonia lower on average. In the Netherlands, salaries are more geographically balanced but strongly influenced by the Randstad region, where most commercial activity is concentrated.
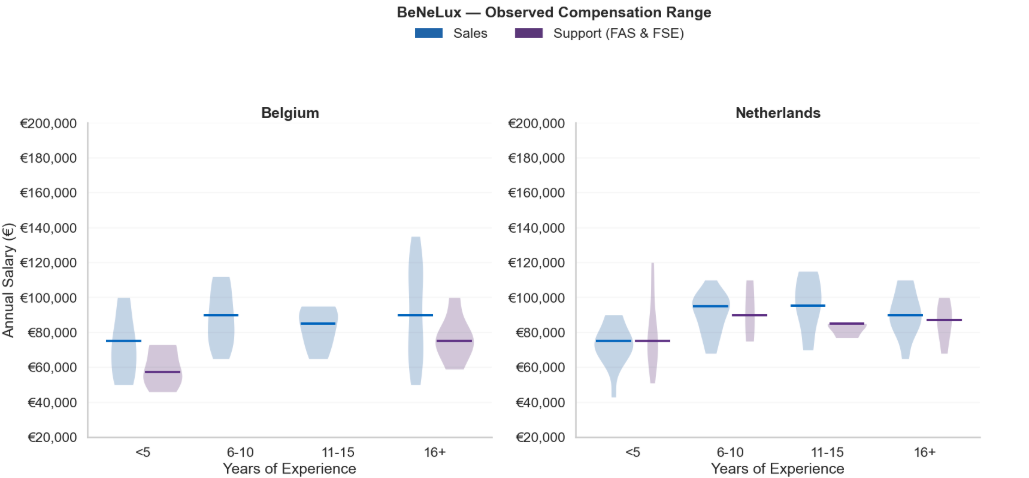
- Salary growth across Benelux is steady and measured. Unlike the sharper acceleration seen in the UK or France, progression here tends to be gradual. The main exception seems to be in Belgium at senior levels (15+ years) in sales. In our opinion, this category often covers broader areas – the whole Benelux. In this region, maturity and the ability to operate across languages and markets are highly valued.
Biotech is under pressure
Budgets are tighter. Growth has slowed (if you want to know where we think it’s heading in 2026, check our first edition). Stretching a salary band now requires strong justification. Every exception is questioned. Every increase is debated.
On the candidate side, we see two different reactions. People who feel secure in their jobs are asking for more money. That makes sense. Changing jobs in an unstable market is a risk – and risk should be rewarded.
At the same time, people coming out of layoffs or unstable situations often accept the midpoint of a salary range – sometimes much less than they think they are worth. For them, stability matters more than upside.
In less protected labour markets, this effect is even stronger. Instead of reducing pay gaps, the current market may actually increase them.
On top of this, new regulation is coming into play. From June 7, 2026, the EU Pay Transparency Directive will require companies to include salary ranges in job ads, stop asking candidates about their salary history, and report on gender pay gaps. The directive entered into force in June 2023, giving member states three years to implement it, but so far only Belgium, Malta, and Poland have published partly final drafts. Once the rules apply in June 2026, companies will need clear and consistent pay structures in place – or they risk facing penalties.
Frequently Asked Questions
What is the average salary for biotech sales professionals in Europe?
Average base salaries for biotech commercial sales roles in Europe range significantly by country and experience: from approximately €55,000 to €170,000 annually in the UK depending on seniority, with Switzerland at the top of the European market and Italy and Spain at the lower end. Base salary ranges are heavily influenced by geographic hub, company portfolio (capex vs reagents), and years of experience.
Which European country pays the most for biotech commercial roles?
Switzerland — particularly Basel and Zurich — is the highest-paying European biotech market. Swiss base salaries are typically €30,000-€40,000 higher than comparable roles in neighbouring Germany or Austria at similar experience levels.
How much do Field Application Specialists and Field Service Engineers earn in Europe?
Field-based support roles (FAS and FSE) typically earn less than field sales but offer more salary stability and less regional variation. In the UK, support role base salaries range from approximately £40,000 to £110,000 depending on seniority and location. Support salaries plateau earlier than sales salaries.
What is the EU Pay Transparency Directive and when does it apply?
The EU Pay Transparency Directive (2023/970) requires companies to include salary ranges in job advertisements, prohibits asking candidates about salary history, and mandates gender pay gap reporting. The directive becomes enforceable on June 7, 2026, after a three-year implementation period from June 2023.
Do US and Chinese biotech companies pay more in Europe?
Yes. US and Chinese biotech companies entering European markets typically offer 20-30% above local market base salaries to accelerate hiring. These offers often include stronger commission structures but may include fewer traditional benefits and come with higher performance pressure.
At what career stage do biotech commercial salaries grow fastest?
The 6-10 year experience window shows the fastest salary growth across European biotech commercial roles. Professionals in this range are experienced and independent but not yet priced at leadership levels. After 15 years, salary growth typically slows or plateaus unless professionals move into leadership roles.
Why do biotech salary benchmarks vary so much between European countries?
Salary differences reflect labour law strength, talent scarcity, biotech hub concentration, company portfolio, currency, and local cost structures. Strongly protected markets like Germany and France show structured progression, while less protected markets like the UK, Italy, and Spain show wider salary variation, particularly in sales roles.
About the dataset
- All salaries are shown in euros. Data from the UK, Switzerland, Denmark, and Sweden were converted into euros using exchange rates as of January 29, 2026.
- The analysis is based on 956 data points collected in 2025 from industry professionals working in customer-facing roles across capex, reagents-focused biotech companies, and distributors operating within the broader -omics space.
- The “Support roles” category refers to field-based support positions that require at least 30% travel, mainly Field Application Specialists and Field Service Engineers. Sales roles represent field-based positions only.
- A minimum of four data points per country × role × experience band was required to display a distribution. Segments with fewer than four data points were excluded. Violin charts illustrate the observed salary distribution. They are indicative only, as segment sample sizes vary.
- Figures reflect base salary only. They do not include bonuses, commissions, pensions, or car allowances. Total compensation varies significantly by country, region, company stage, and local labour laws, and would require a separate analysis.
- Years of experience are calculated from the first relevant full-time, customer-facing role in the field. Academic training and internships are excluded.